We had the following problem at work that was causing lot of trouble and stress, sometimes, apparently out of nowhere back-end response times started to grow on every request until they reached the timeout value and all requests started to fail with a 504 response code causing chaos, mayhem and management complaints. Here are the analysis of the situation, the measurements taken and the results.
Description

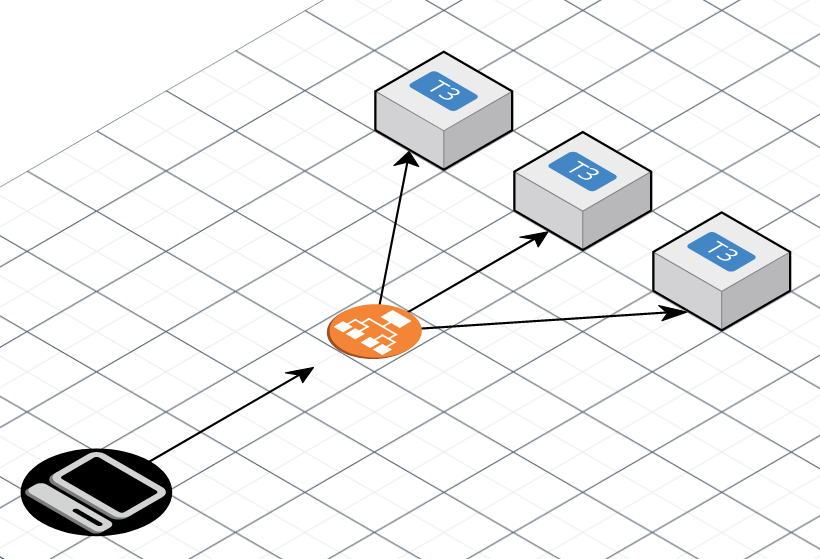
The application was conformed of several AWS t3 instances using Nginx for serving a PHP application making use of PHP-FPM. Clients, represented as the computer on the black circle, were making REST calls to on Application Load Balancer and this component would route the request to any of the t3 instances situated in the Target Group. The instance would then receive the request, process it and then finally return the result.
The problem of all requests timing out continued repeating over time with no apparent reason and solutions like increasing the back-end instances size and number seemed not to help, also all the instances on the Target Group were reported as healthy so the ALB was routing requests to them even that all their requests were timing out. Individually analyzing the code for each request involved in the incident was no help either because we had all kinds of them requesting all kind of actions, the only conclusion that could be gotten from analyzing the incoming traffic is that it seemed to be a certain correlation with high traffic bursts but these were not always present when the problem appeared.
Situation Analysis
The first step for analyzing an emergency situation like this should be always a good information gathering process. We needed to take a look on all the sources of information we could get, whether this is data coming from the components causing the trouble or information on how the components actually work from their documentation. So we could start from the most apparent symptom, the timing out of the requests.
Timeouts
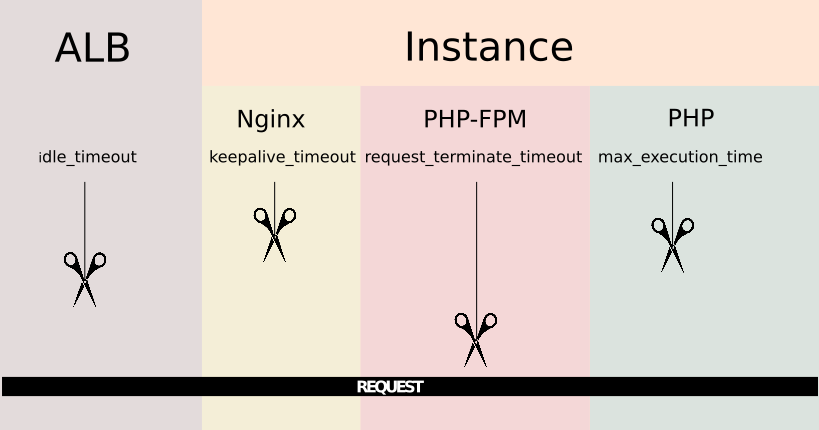
To understand why a timeout can occur, you need to know first how a request is passed from one component to another. In this particular case, the first component to receive the request is the ALB. AWS Application Load Balancers come with a configuration parameter called idle timeout. The Load Balancer passes the request to the next component and waits for a response, this is the maximum time it will wait for the components underneath to respond, if this times passes and no response has been received it will directly inform the client making the requests that its request has timed out.

If we continue to the next component, then we get to the instance. As mentioned, the instance is running Nginx so this is the software that will deal with the request. It has a configuration directive called keepalive_timeout Nginx will close connections with the client after this period of time.
Going deeper, Nginx passes the request to PHP-FPM using the fastcgi directives. Now that it's PHP-FPM the one that has the request and can also timeout the request based on the value of the option request_terminate_timeout from the pool configuration i. e. /etc/php/7.2/fpm/pool.d/www.conf, this option comes disabled by default. Finally PHP also comes with its own timeout configuration parameter called max_execution_time placed on etc/php/7.2/fpm/php.ini.
So the chain of possible timeouts goes like this, I like to imagine like a set of scissors placed one after another, the scissors are moving down and all of them start from a distance of the thread that represents the request.

With this picture in mind I did a proof of concept creating a similar scenario containing a simple PHP script that would timeout by calculating numbers, or executing sleep (be aware that the sleep times does not count on max execution times when your server is a unix system). Playing around with these configuration values I could end the connection timing it out from different components and observe the results to diagnose uncontrolled timeouts. Some useful observations were:
Timing out a request because PHP's max_execution_time is reached will leave a message like the following on the Nginx error log i.e. /var/log/nginx/error.log but nothing on the PHP-FPM log.
2019/03/26 20:05:05 [error] 9674#9674: *134 FastCGI sent in stderr: "PHP message: PHP Fatal error: Maximum execution time of 20 seconds exceeded in /var/www/html/index.php on line 4" while reading response header from upstream, client: 134.27.35.127, server: test.namelivia.server, request: "GET / HTTP/1.1", upstream: "fastcgi://unix:/var/run/php/php7.2-fpm.sock:", host: "poc.e-valua.es"
In case of ending the connection because PHP-FPM request_terminate_timeout is reached this is the message that will leave on Nginx error log:
*1 recv() failed (104: Connection reset by peer) while reading response header from upstream
But now this message will appear on the PHP-FPM log i.e. /var/log/php-fpm7.2.log:
[26-Mar-2019 20:09:28] WARNING: [pool www] child 10513, script '/var/www/html/index.php' (request: "GET /index.php") execution timed out (10.311994 sec), terminating
If Nginx timeouts the connection will leave a message like this on its error log:
2016/07/12 19:24:59 [info] 44815#0: *82924 client 82.145.210.66 closed keepalive connection
And finally, if it's the ALB the one that closes the connection, there may not be any messages logged on the instance because it may even keep doing it's processing when the ALB has already discarded the request.
Slow requests
Once all timeout configurations are understood and tested, it's time to identify what causes the requests to start collapsing and taking more and more time to be fulfilled until they hit the maximum timeout values. While testing timeouts I could observe some messages like this on the PHP-FPM log files:
WARNING: [pool www] server reached pm.max_children setting (5), consider raising it.
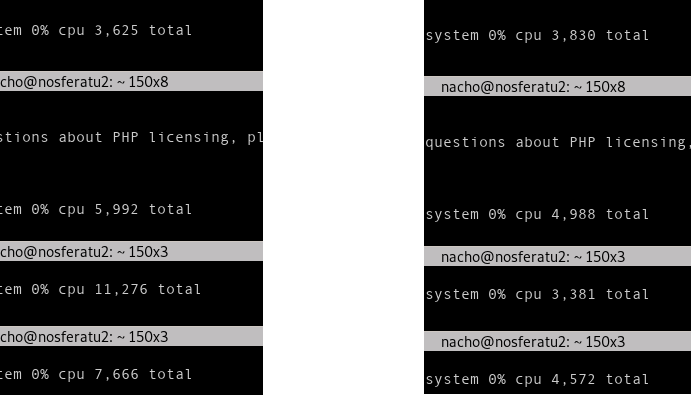
As this is pointing to PHP-FPM process manager configuration the next step was to force some resource depletion scenarios. To configure the process manager I played with the parameters like pm, max_children, start_servers, min_spare_servers, max_spare_servers and process_idle_timeout. I tested different configurations and made some stress tests where I could exactly replicate what was happening in the production server. When having PHP-FPM's pm set to dynamic while the max_children parameter and spare_servers set to 1 I could then start performing concurrent requests that would take several seconds to be fulfilled. On a PHP resource depletion scenario the requests started to queue and its processing time would exponentially grow until reaching timeout values. Here is a comparison of the behavior a few requests in both scenarios.

The reason for this is that PHP-FPM has some "slots" defined for dealing with incoming requests, once a request occupies the slot then the next request will go into the next available slot. If all these slots are full the warning mentioned above will be printed on the log and the request will wait for the next free slot to be processed, all this waiting time is also time that counts for the request to timeout so if requests are arriving at a faster pace than they are leaving the will start to enqueue indefinetly and that's the exact cause that was bringing down our systems.
The very first measurement then for avoiding this was tuning the PHP-FPM pm configurations on the EC2 production instances. There are many ways for doing this and I read quite a lot of good articles on the topic. Finally I decided setting an static pm management mode adjusted to the instances available RAM and the average process size. I also added some free memory graphs and alerts on Amazon Cloudwatch so I could graphically see and monitor how memory consumption was varying and how much free memory was left.

I also decided to set max_requests parameters to avoid memory leaks, this parameter will make PHP-FPM to restart after a number of requests managed in case it is degraded, this seemed convenient.
PHP-FPM and Healthchecking
After accordingly setting timeouts and PHP-FPM process management the application began to effectively manage the request bursts begin sent from the client and we could have stopped there but there was one thing left, when PHP-FPM started to overload on an instance the Load Balancer would not stop redirecting new requests to it, this was because actually the Load Balancer had no idea about the status of PHP-FPM because of the healthcheck for the target group being directly resolved by Nginx. Remember the request chain mentioned before? Well, as long as Nginx received a healthcheck request it would not pass down the requests, if it was running and OK it would just answer with an OK by doing this on a server block:
server {
  listen 80 default_server;
  location /health-status {
    access_log off;
    return 200;
  }
}
So if there are problems like the one we were having it would remain unnoticed. We can take advantage of the fact that PHP-FPM already comes with a status report service and a ping service that are disabled by default, so these can be easily enabled by setting the parameters pm.status_path and ping.path, on the pool configuration. Then the new server block for checking the health of the instance would be:
server {
  listen 80 default_server;
  location ~ ^/(ping)$ {
    acess_log off;
    fastcgi_param SCRIPT_FILENAME $document_root$fastcgi_script_name;
    fastcgi_index index.php;
    include fastcgi_params;
    fastcgi_pass   unix:/var/run/php/php7.2-fpm.sock;
  }
}
By enabling the status page we can also get valuable information on how PHP-FPM process management is doing, I leave for a future research a way to link this information to Amazon Cloudwatch metrics because this could be really nice and useful.
Orchestrating with Chef
The whole set of measurements resulting from my research were implemented on the production machines and these were monitored for a few days. After checking that our client traffic burst were successfully being processed without timing out there was one last step left, all our machines are automatically set up by Opsworks making use of a set of Chef recipes I wrote. Then I had to include all this measurements on these recipes so every instance would be correctly tuned when created. To uncomment the status and ping pages for example on the configuration files I would use a ruby_block like:
ruby_block 'replace_line' do
  block do
    file = Chef::Util::FileEdit.new('/etc/php/7.2/fpm/pool.d/www.conf')
    file.search_file_replace_line(';pm.status_path = /status', 'pm.status_path = /status')
    file.search_file_replace_line(';ping.path = /ping', 'ping.path = /ping')
    file.write_file
  end
end
And then check the results on the kitchen tests like:
describe file('/etc/php/7.2/fpm/pool.d/www.conf') do
  its('content') { should match(%r{^pm.status_path = /status}) }
  its('content') { should match(%r{ping.path = /ping}) }
end
I could then set every other pm parameter like this, except for pm.max_children, because as we saw earlier this parameter cannot be safely calculated without knowing the actual memory consumption the machine, but we can make an approximation based on the instance RAM size. I've assumed that the average process memory consumption would be 50 MB that may not be true, but I prefer being conservative, I've also reserved 300 MB just in case:
# Max children calculation
memory_in_megabytes =
  case node['os']
  when /.*bsd/
    node['memory']['total'].to_i / 1024 / 1024
  when 'linux'
    node['memory']['total'][/\d*/].to_i / 1024
  when 'darwin'
    node['memory']['total'][/\d*/].to_i
  when 'windows', 'solaris', 'hpux', 'aix'
    node['memory']['total'][/\d*/].to_i / 1024
  end

average_process_need = 50
unused_memory = 300
max_children = (memory_in_megabytes - unused_memory)  / average_process_need
ruby_block 'set_max_children' do
  block do
    file = Chef::Util::FileEdit.new('/etc/php/7.2/fpm/pool.d/www.conf')
    file.search_file_replace_line('pm.max_children = 5', "pm.max_children = #{max_children}")
    file.write_file
  end
end
Now because I have defined on my .kitchen.yml that my test will run on t2.micro EC2 machines I can know the number of max_children that will result from my calculation while running the kitchen tests:
its('content') { should match(/^pm.max_children = 13/) }
It is worth to mention that the php7.2-fpm service needs to be restarted in order to apply changes.
Now after checking the state the machines are booted and setup in we can safely create and destroy new instances and redirect our client traffic there safely.
Conclusion
The purpose here was to reacting accordingly and reasonably to an unexpected state of the service. By strictly following the steps of information gathering and documentation reading we obtained information to identify the bottleneck, then performed a proof of concept to ensure the problem's origin, design and implement a solution and ultimately fix it permanently by automating the solution into a chef recipe. This also helped us learning more and achieving a better understanding on how PHP, PHP-FPM, AWS and Nginx works.
