This is a short post on how can you plot some data in a simple and fast way from your unix terminal using gnuplot.
Usually people tend to generate plots using office suites that are tools designed to many pruposes apart from just drawing tabular data in a a plot and waste their precious time opening the suite, manually configuring the plot and everything while with this tool it can be done in just a few seconds.
gnuplot is actually a very featured tool that can be used to create a huge variety of plots but in this particular case we will just focus on fast plot creation, thinking on the need of making a fast measure and plot creation.
Let's suppose we are in charge of the infrastructure of Google and we get a phone call from our boss asking what time does the server take in order to respond ping requests. So lets make 100 ping requests and write the output to a file with this simple command ping google.com -c 100 > output then we wait for a bit and check the contents of our output file that will look like this:
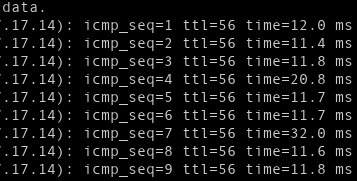
This is an example of a data sample I've came up to, but any kind of data can be generated, for example script execution times is a very interesting one too.
In this particular case the file must be cleaned up first, but that can easily do in a oneliner too with the use of grep to discard the unwanted lines and awk to split and select the interesting fields like grep ttl output | awk -F '=' '{print$2" "$4}' | awk '{print $1" "$3}' > clean_output
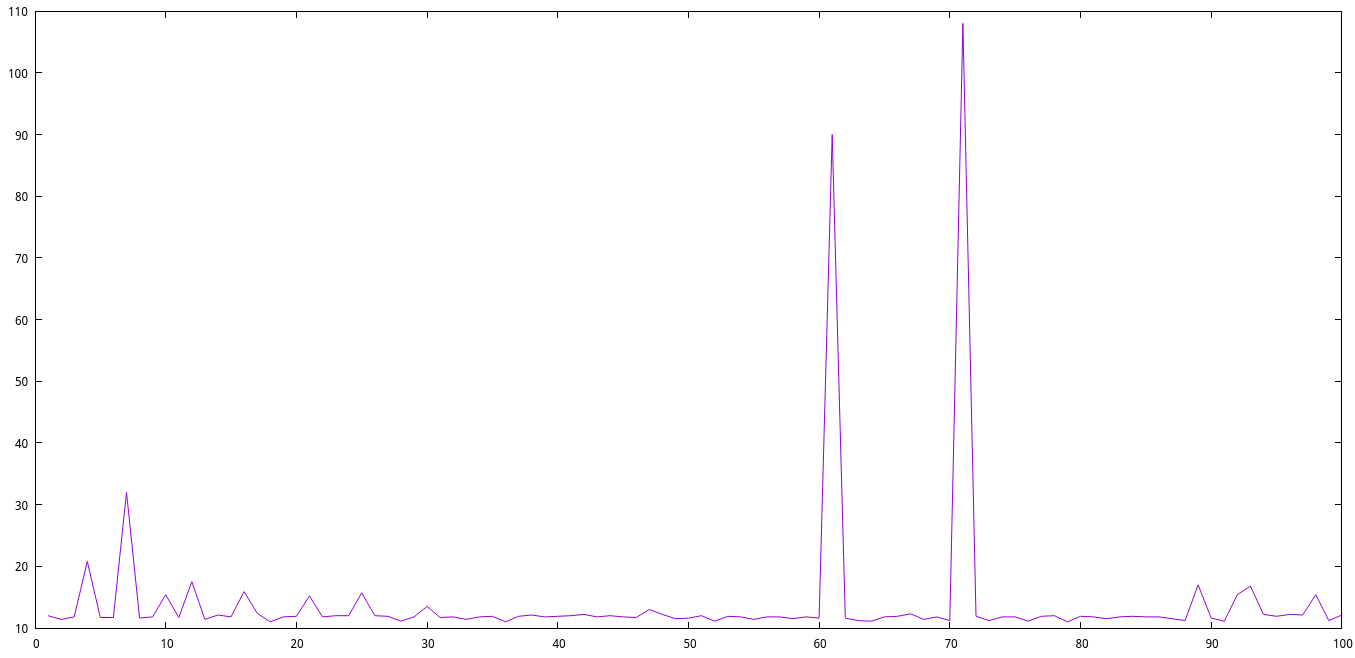
Now that we have our data we would install gnuplot using the standard procedure, run it and then just plot the data file using a one-liner like plot "clean_output" with lines notitle.
Then we will get a plot like this that we can export as an image, pdf, or svg and attach it to our response email to our boss, all in just a few seconds.