This brief post will be more like a note for my future self, to know how to setup Xdebug for debugging complex problems on PHP code that is running inside a Docker container.
There are thousands of articles for setting up debugging on a complex IDE like PHPStorm, but if you like minimal configurations like me, you can just download and run the minimal DBGp client from the official Xdebug website.
A simple way of doing this would be:
wget https://xdebug.org/files/binaries/dbgpClient
chmod +x dbgpClient
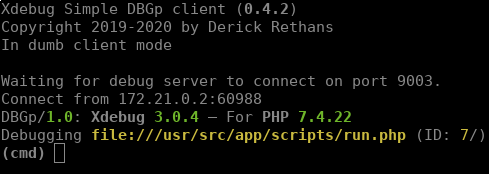
./dbgpClientNow the debugging client will be waiting for connections on our host machine, the following message will be prompted:
Waiting for debug server to connect on port 9003
The next thing is going to be installing and configuring Xdebug inside the docker container, and make it connect the host machine in that port. To install Xdebug the following lines need to be added to the Dockerfile.
RUN pecl install xdebug \
    && docker-php-ext-enable xdebug
That would install it when building the container, and for configuring it we need to copy the configuration into the container, so I will create the following configuration file into a folder in my project like ./docker/php/conf.d/xdebug.ini and put there the following configuration parameters.
zend_extension=xdebug

[xdebug]
xdebug.mode=debug
xdebug.client_host=172.21.0.1
xdebug.start_with_request=yes
Now here it comes the tricky part, the client_host ip changes and you need to figure out which one is yours, in order to do so you need to inspect the docker network your container is running in using docker network ls and docker network inspect with the network identifier. You will get a json structure and there you need to pick the ip from IMAP > Config > Gateway.
Don't forget to setup the configuration files ont he volumes section of the docker-compose.yml file so it gets copied to the container.
volumes:
    - ./docker/php/conf.d/xdebug.ini:/usr/local/etc/php/conf.d/docker-php-ext-xdebug.ini
Once you do so, you can just start the container and execute the script, and then you will see the client that was waiting connecting and getting into interactive mode. Happy bug hunting!