
Finished product:
This time I'm going to write about a little project I made some time ago. Since I wanted to solder the cables it's a good time to disassemble and assemble it again and show you how to make it.
Materials
The only things needed are:
- One Arduino board, mine is Arduino Duemilanove.
- One LM35 temperature sensor.
- Some cable.
- One USB cable.
- One computer.
Electronics
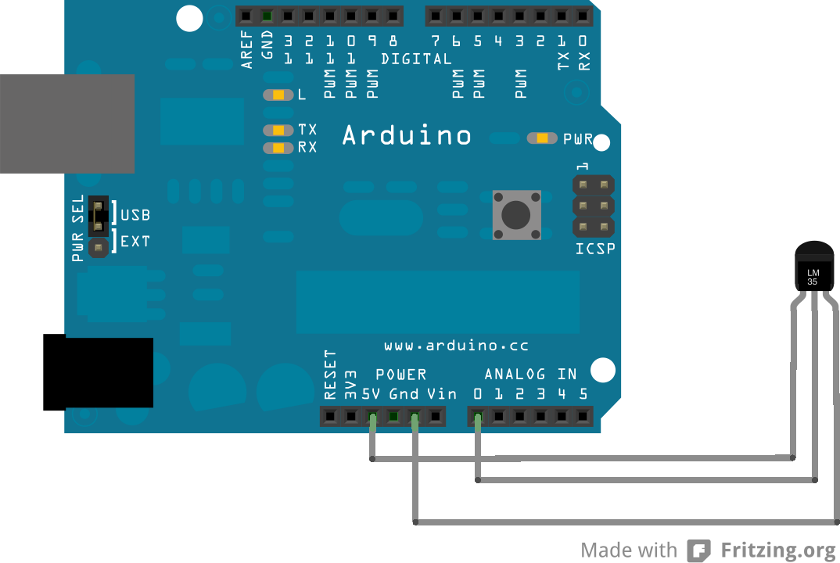
The electronics setup is extremely simple. Just connect the LM35 temperature sensor to the Arduino like this:
As I said before, I soldered some cable to the sensor's legs to connect it.
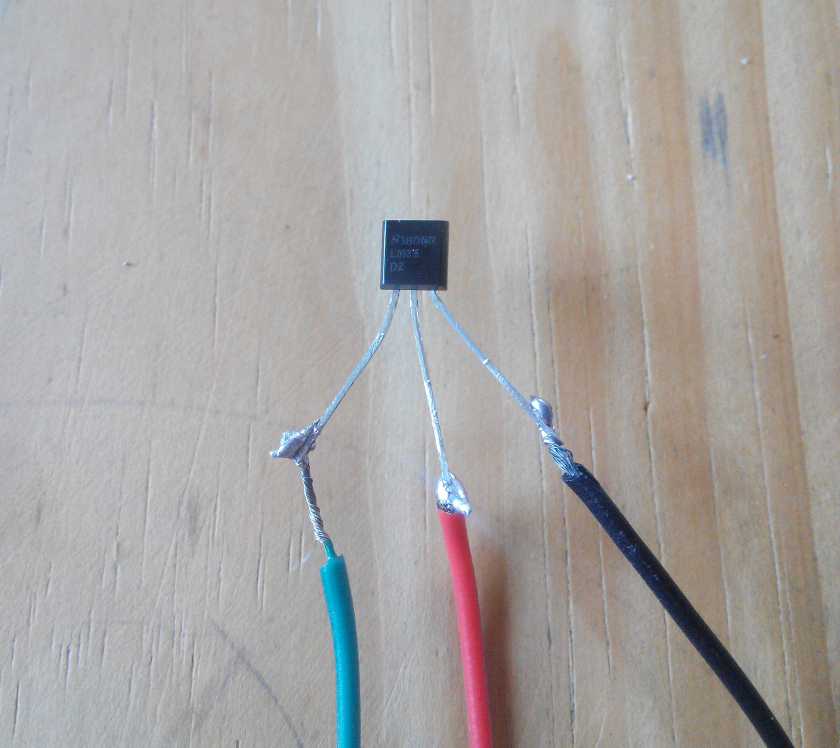
The solder is pretty bad, and later when applying some tape to cover the soldered parts one of them broke. This soldering tin I bought in a bazaar is the worst buy I've ever made.
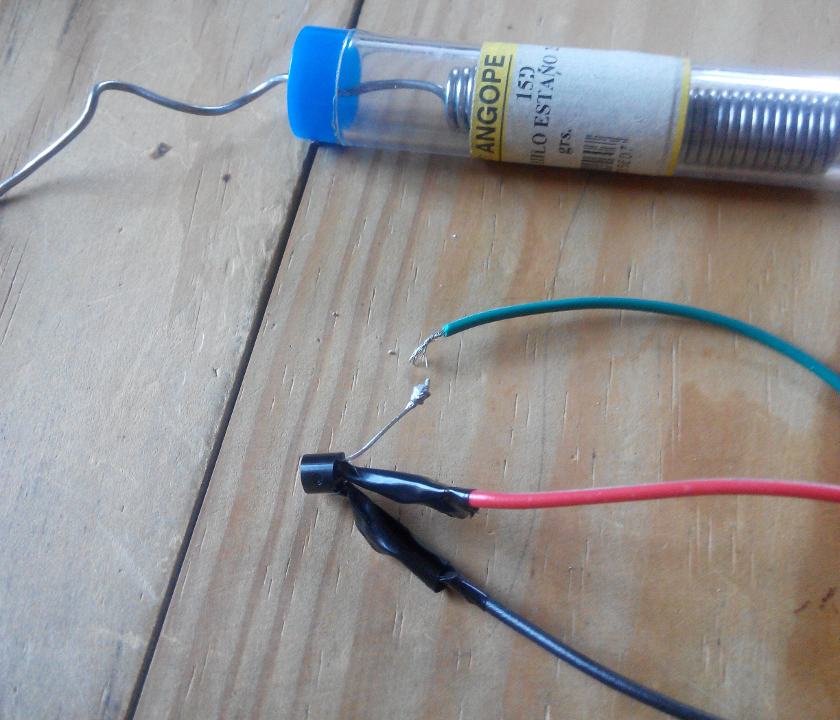
But finally I managed to solder everything and cover it using the tape, and then connect it to the Arduino as shown in the schematics above.
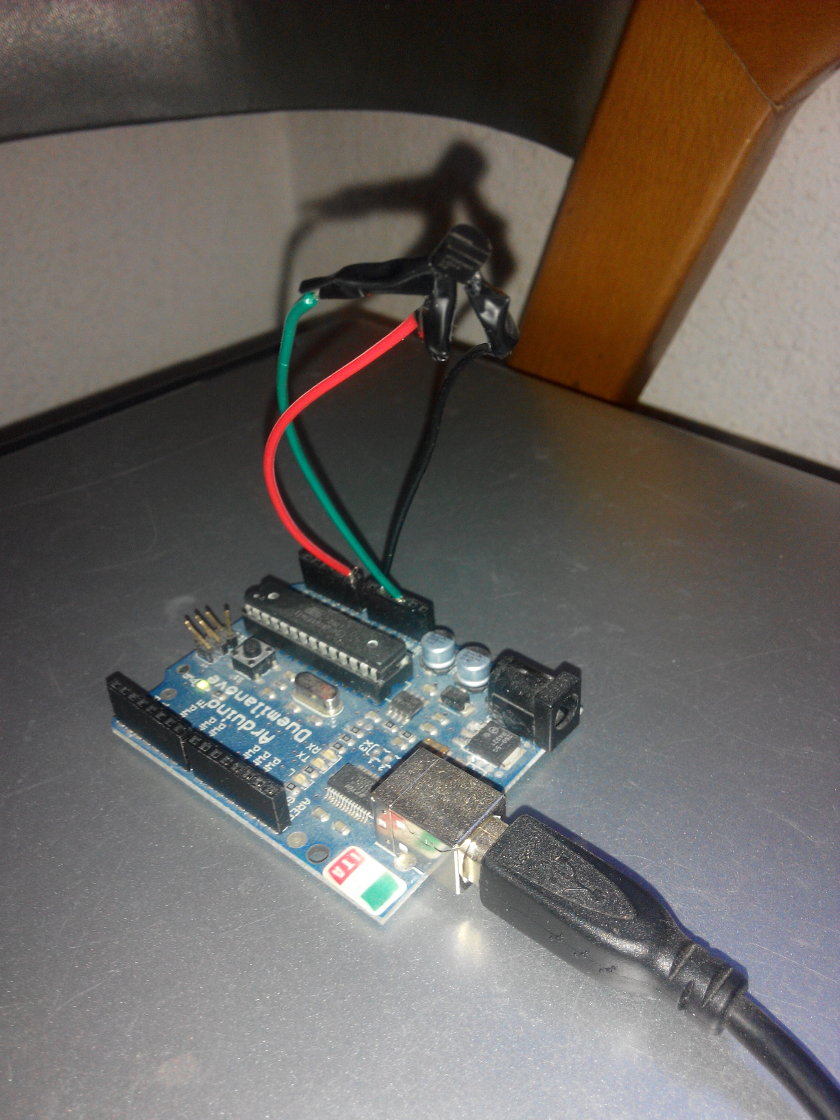
And that's it! Just plug the Arduino to the PC using an USB cable and the electronics part will be finished.
The sketch to streaming the temperature to the PC can be found very detailed in this Adafruit's post. In my case I'm just streaming the centigrade temperature.
Data retrieval and storage
The data is streamed from the Arduino to /dev/ttyUSB0, can be printed out in the console executing a little bash script like this:
#!/bin/bash
stty -F /dev/ttyUSB0 9600 cs8 -cstopb -parenb
read -n 8 TEMP < /dev/ttyUSB0
echo $TEMP
Now that the temperature can be retrieved, I chose to store it in a mySQL database. I created a small database with just one table and the following fields:
id - int(11)
temperature - decimal(4,2)
time - current_timestamp
Just the temperature and the time it was measured. Then the temperature reading bash has to be updated to store the temperature on the database, like this:
#!/bin/bash

stty -F /dev/ttyUSB0 9600 cs8 -cstopb -parenb
read -n 8 TEMP < /dev/ttyUSB0
echo "INSERT INTO temperature (temperature) VALUES ('$TEMP');" | mysql -udbuser -pdbpassword dbname

exit 0
Instead of dbuser, dbpassword and dbname the appropriate mySQL credentials should be written.
Finally, I added the script execution to my cron table, to be executed once each 15 minutes.
*/15 * * * * /user/scripts/read_temperature.sh
This way the temperature will be automatically stored in the computer. I have stored the temperature data of the last year every 15 minutes. This can be a little excessive, but the data can be manually cleaned at any time.
Serving the data
For serving the temperature data , and to be queried from anywhere or any device I've created a small nodejs application. It has just one javascript file like this:
var express = require('express'),
      util = require('util'),
      bodyParser = require('body-parser'),
      methodOverride = require('method-override'),
      mysql = require('mysql'),
      app = express(),
      port = 60000,
      db;

  //Middleware: Allow cross-domain requests (CORS)
  var allowCrossDomain = function(req, res, next) {
      res.header('Access-Control-Allow-Origin', '*');
      res.header('Access-Control-Allow-Methods', 'GET,PUT,POST,DELETE');
      res.header('Access-Control-Allow-Headers', 'Content-Type');

      next();
  }

  app.use(bodyParser());
  app.use(methodOverride());
  app.use(allowCrossDomain);

  var connection = mysql.createConnection({
      host: 'localhost',
      database: 'dbname',
      user: 'dbuser',
      password: 'dbpassword'
  });

  getTemperature = function(req, res){
      connection.query('SELECT * FROM (SELECT temperature,UNIX_TIMESTAMP(time) as time FROM temperature ORDER BY id DESC  LIMIT 1000) as tmp ORDER BY time', function(err, rows, fields) {
          if (err) throw err;
          res.send(rows);
      });
  }

  app.get('/temperature', getTemperature);

  app.listen(port, function(){
     console.log("Noder server running on port "+port);
  });
Again, instead of dbuser, dbpassword and dbname the appropriate mySQL credentials should be written in the script.
Then the script can be executed using forever.
Basically what the script does is to serve the last 1000 measurements on http://localhost:60000/temperature.
Data display
For displaying the data, I made a simple html file, exposed to the outside through nginx that will query that data on the 60000 port and display it using highcharts.
The code is just javascript and html:
<!doctype html>
<html>
    <head>
        <meta charset="UTF-8">
        <script src="http://ajax.googleapis.com/ajax/libs/jquery/1.8.2/jquery.min.js"></script>
        <script src="http://code.highcharts.com/highcharts.js"></script>
    </head>
    <body>
        <div id="container" style="width:100%; height:300px;"></div>
    <script>
        $(function () {
            $.get( "http://localhost:60000/temperature", function(data) {
                var data = $.map(data, function (value){
                    return [[value.time*1000,value.temperature]];
                });
                $('#container').highcharts({
                    chart: {
                        zoomType: 'x'
                    },
                    title: {
                        text: 'Temperature at home'
                    },
                    subtitle: {
                        text: document.ontouchstart === undefined ?
                                'Click and drag in the plot area to zoom in' : 'Pinch the chart to zoom in'
                    },
                    xAxis: {
                        type: 'datetime'
                    },
                    yAxis: {
                        title: {
                            text: 'Temperature (Cº)'
                        }
                    },
                    legend: {
                        enabled: false
                    },
                    plotOptions: {
                        area: {
                            fillColor: {
                                linearGradient: {
                                    x1: 0,
                                    y1: 0,
                                    x2: 0,
                                    y2: 1
                                },
                                stops: [
                                    [0, Highcharts.getOptions().colors[5]],
                                    [1, Highcharts.Color(Highcharts.getOptions().colors[3]).setOpacity(0).get('rgba')]
                                ]
                            },
                            marker: {
                                radius: 2
                            },
                            lineWidth: 1,
                            states: {
                                hover: {
                                    lineWidth: 1
                                }
                            },
                            threshold: null
                        }
                    },
                    series: [{
                        type: 'area',
                        color: '#991111',
                        name: 'Temperature',
                        data: data
                    }]
                });
            });
        });
    </script>
    </body>
</html>
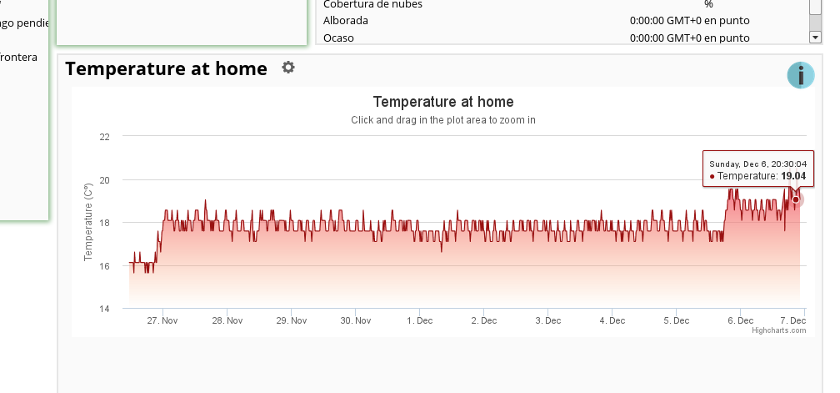
Finally for displaying the graph inside Owncloud I made a custom widget for ocDashboard. But now ocDashboard allows to insert widgets containing an iframe, so I can just insert an iFrame widget and point it to the path of the temperature graph.
Voilá! The current temperature inside of my house, displayed on my Owncloud dashboard.